|
Last Saturday, September 2, we hosted a chat in the Halls of Volgaard Discord server. This chat was open to Volland subscribers. This informal chat and Q&A allowed members to chat about how their week went and ask Wizard of Ops any questions. This transcript removes identifying details about chat participants, as well as non-trading related chatter.
Question: At some point during the last one hour on Friday, September 1, aggregate charm was about -5 billion. You indicated that 1 billion is about ten points on a graph. Should one have expected a large move at the end? We know it did not materialize. Answer: So we're going to get into the weeds of calculation a little bit here. From a natural calculation perspective, charm is supposed to be the movement of Delta for one day passing (like plus one day passing). We have shortened it. We have changed that to one hour of passing. So when you look at charm here in SPX, you are going to see how much they would have to hedge for one hour of passing. When you see 5 billion, you would have to divide it technically by the portion of an hour that you have. We tried to put that into Volland. We tried to, I guess you could say, create a situation where it's always giving you the time until the end of the day. The problem is, when we do that calculation, then it weighs too heavily in the beginning of the day and it weighs things that have like 20 days left due to IV. So we decided to keep it like this - at one hour. So when you see something like 5 billion with like 5 minutes left, you have to divide that 5 billion by 20 in order to get a decent, accurate charm hedging number. Question: And that relationship is still valid over the last year where options volume has become much shorter dated? Answer: Are you talking about spot vol correlation relationship? In short, yes, the spot vol correlation actually strengthened recently. A lot of the hedging has been done intraday, like when there's big super moves... intraday vol has changed a bit, but not so much the 30 day vol and market makers still price it. I think it's actually been strengthened by that VIX spot vol correlation. Question: How do you judge the changes in IV intraday when IV is naturally decaying? Answer: The natural decay is caught in charm. So, the implied volatility changes are independent of the time aspect. So vanna and charm, while they're related because they're related to the same thing, are measuring the natural decay, which is charm, versus the implied volatility change, which is vanna. And it's easy calculation-wise to separate it, because you already know how much trading time there is to expiration. So you have to wait a little bit, but it's pretty... I don't want to say "simple"... I mean, it's mathematical, but it is a good way to take out fluctuations. You have a standard for how long time takes. Question: Would gamma have any influence on price action and intraday activity? Answer: Yes! So the thing with gamma is when you have big strikes in gamma in 0DTE, it's like a little sugar rush... because while the actual number gamma is higher, the I guess you could say "sphere of influence" is a lot narrower. So let's say you're at 4500 or something like that, the gamma exposure is, you know, 2 billion per point, right? Per point of SPX... Let's just say it's like 2 billion or something like that... It is pretty much isolated to that one spot. Like to 4500. I mean, yeah, it expands a little bit to 4510 and a little bit to 4490, but if it's 2 billion a month out at 4500, then it'll be 1 billion out at 4400, it'll be 500 million out at 4350. And typically, the gamma is lower the further out you are. So the sphere of influence is wider, but it's smaller. So when you see something like a 0DTE high gamma strike getting crossed, you might see something like a quick five point jolt, but then it's done very quickly. Because the sphere of influence on that is pretty small. That's because the price changes pretty quickly, too, when you pass those strikes. I like to measure those kinds of things in charm, just because I can conceptually see it that way. And that's why I put charm in the 0DTE alerts. But, you know, gamma has just as much of an impact. I could tell you what the spot vol correlation is right now... The R squared is 50.57. So yes, it's still strong, but not exceedingly strong. The correlation is -0.75. So basically for every percent gain in SPX, VIX should be coming down by 0.75 points. Question: Less of a question, more of an observation. I know 0DTE charm works somewhere around 90% for predicting moves. In the off 10%, have you seen a correlation of other market factors which tells you that charm will not work on a certain day? Answer: There are a couple of things. Number one, the overvixing/undervixing kind of thing means that you have to pay attention to higher-order vanna. Number two, a lot of times we call them "macro bros"... As much as I'd love for option dealers to be the only traders, by definition, the fact that there are people in this room means that option dealers are not the only traders. So, there are other people who are trying to position in the market. There are earnings, there's, you know, all kinds of stuff. So when you say, "What market conditions do I think charm won't work?" I don't think it's necessarily a market condition as much as it is a macro condition or a condition that's outside of option flows. That's when charm doesn't work. One of the things that we're making as we evolve here in Volland is a lookout tower. So, stuff like... how are high yield bonds doing, how are Treasuries doing? If yield goes way up in treasuries most of the time that's a drag on equities because there is an alternative to equities in returns. So, I mean, there's things like that that we are going to have like a lookout tower of other things that will work other than charm. So essentially the answer is when somebody else has an incentive to trade, they may influence a market more than 0DTE trader. Question: So the other day, yesterday, actually on the daytrading chat, you came in and you talked about when vanna is low, that can mean the market can have wilder swings. Is that because there's lower liquidity in the market? So therefore, because there's more liquidity, obviously there are wild, wild swings and whatnot. Can you explain that again a bit more to me? Because that became interesting to me when you guys were talking about it. Answer: So when I said low liquidity in the market, I think somebody out there sent me a note that they pointed out that they prove there's liquidity in the market or whatever. What I'm saying, when Vanna is low under pretty like 50 million, you know, like when it's really, really low, that means that option market makers are getting wider spreads... and wider spreads between the bid and the ask is a sign of liquidity for the option market makers. Now if there is not a lot of vanna in Volland, like there's not a lot of supportive flows, like there's not a lot of puts being bought or something like that... To me that's a sign that (then, you know, this is kind of supported by what other people have told me too) people aren't buying puts. That means they're not hedging, and if they're not hedging, that either means they have a ton of dry powder, which... Why would you do that right now when markets are going up, OR they are losing liquidity. And with higher interest rates, even on the overnight RRP, with higher interest rates overall, it would not surprise me if liquidity is going down. And they keep you know, you see what treasuries are doing right now. Interest rates are going up. So we noticed, and you can look on the studies page, we noticed that... as aggregate vanna comes down, you begin to see wilder swings in the market. And I think that's because you are going to see a lot less liquidity. When Vanna comes down close to zero and those bid ask spreads are getting wide, that's when I think option market makers have less liquidity and then, you know, all hell breaks loose. I think that's the situation we were in during COVID and it was also the situation we were in in Volmageddon in February 2018. So, that's kind of what I was getting at. It's also why I said in my tweet, this is why we're not at that point yet. We're not at a point yet where liquidity is a problem yet, but it is a sign that liquidity is coming down from investors' pockets. Question: A lot of us know when we're trading during the day, we often will look at charm. Sometimes I know that that charm will change rapidly. When we're looking at charm, and from your explanation with gamma, should we also combine our charm readings with what's happening with gamma, or should we just stick with the charm and vanna? If we're looking for like, swings, these sort of like entries or whatnot, because normally, especially with swings and all that, you see that gamma is what we should look at for our entries and supports and resistances. But what about intraday? Should we use another metric as well to kind of give us more confluence? Answer: When it comes to charm, yes, gamma has an impact intraday. However, it is easy to read through when you're looking at charm. You know that when it is red charm, below the money, you know that those are customer-bought puts and dealers are short puts. And so you already know that that big red bar is charm underneath. It is also going to be big negative gamma. So the other thing too is that Gamma doesn't show you the full picture as well either. Let's say you have a big red bar underneath, but it's just because you pass over a certain call level... dealers were short calls, the market advanced, and now that call is out of the money so now it's red. The dealers are really more impacted by the reduction in implied volatility at the end of the day, since it's going to zero. And a lot of times it's like 20% at 1:00 p.m. So I mean, they're more impacted by the vanna and charm impacts than they are in gamma toward the end of the day. In the beginning of the day, I would look at gamma to see when dealers will, for lack of a better word, "freak out". Like when they say, "Uh oh, we're way offsides here. The market has moved too much for our position. We have to hedge now." I think that's a good time to use gamma. It is something that I even would have to master. When we made Volland Live available, I only had it for about a month longer than you. So I obviously know the theory behind it and the study behind it, but there's part of it that's an art. I think that when you see the big gamma numbers on the cumulative gamma, on the intraday, I think that's probably a good study to do when, I'm thinking about it now as I'm talking through it. It's probably a good study to do like "What is that gamma threshold range when dealers will step in to defend their position, I might say, on a Bank of America paradigm?" or something like that. So in short, I think the answer is at the beginning of the day, and I'd have to probably do a study to determine what the gamma thresholds would be in order for dealers to hedge at some point. Question: I was just wondering if we should also have other metrics up there as well, like where should we look at like vanna as well? Or is it just that we should only look at a charm because charm just tells us everything else that we know? Answer: Vanna would show you the same exact thing that charm is, except it would just be showing you probably like opposite signs. But yeah, if you're doing intraday vanna, it would just show you the same exact thing that charm is showing you. Gamma would be a little different though, and mainly because you don't know if it's in the money long calls or in the money short puts. They would show the same in charm, but they wouldn't show the same in gamma. The more and more I think about it, the more I think you might have a point. When I say lines in the sand particularly in like the BofA paradigm, I'm wondering if the gamma levels are what ignites the hedge and not the charm levels. I mean the charm level's line in the sand works pretty well. I bet that it would line up interestingly with cumulative gamma levels that we would see. That's interesting. It's an interesting thought; very curious. Question: How could one use DAG as a supplemental metric to charm for intraday trading? Answer: I would use gamma and see that as support and resistance as opposed to DAG. The reason why is because basically the only thing that DAG is doing that is changing anything with the calculation of gamma is flipping the sign of anything above current price from negative to positive or vice versa. And the reason why is we were trying to display, particularly on cumulative, we were trying to display a bullish versus bearish indicator. If you were to do it on intraday trading, first of all, gamma is always strongest at the money. And if you were to cross over the large DAG strike, like let's say it's 4500 and you go from 4501 down to 4499 and it's only a two point decrease. It really doesn't make that much of a difference. But in DAG, we would show like, you know, 2 billion flipped from positive to negative and that might throw you off a little bit. Question: I have a question that adds on to the last question. You kind of mentioned that say, there's a big gamma strike at 5500 and you move over it by two points. How do you know that it's now going to act as a resistance instead of a support level? Answer: When you're talking about something like resistance and support as it relates to gamma, more often than not, when you read about it in like SG kind of things and they say, "Oh, it's a big gamma strike. This is going to act as resistance or it's a call wall or something like that." That is more of a vanna phenomenon. It is not that much of a gamma phenomenon. Because gamma doesn't flip sign as you cross over it - vanna does. And so, that changes dealer behavior. And that is what you're looking for when you're looking for support and resistance, is a change of dealer behavior. Now, when you see a strong positive gamma strike, it will provide a little bit of resistance as you approach it. And once you cross over it, it's not all of a sudden like a "breakout". It will still be resistance as you start going, because it is just becoming less and less of a resistance as you keep going. So when I say it's like support and resistance, I'm more or less talking like generally like strong positive gamma strikes are like support and resistance, but if you cross over it, you're not going to break out. Like it's not like a technical indicator where that happens. That's why I personally even like to look at regular gamma. As you cross over that strike, it is still impacting price negatively as you're going away from it. But it's less impactful as you pass it. Because gamma is not changing sign, so it's having the same impact... it's almost like "How much of an impact is it having?" Question: Just to clarify, when that strike crosses that gamma area, we don't necessarily look for price to react to other entities to see how price is, so once that area is crossed, we know. Answer: Not because of Gamma, because of vanna, you might expect it to stop. I know that online, all the "GEX addicts" would have you believe that because of gamma, we are stopping at this strike. It's not true. It's because of vanna. There was nothing at the strike. I mean I always like to look at charm myself and Vanna too, because then you know how strong that really is. If you're looking at Volland Gamma, it's obviously more accurate than just OI-based gamma. If you're talking about intraday, I mean know, again, I really want to study the impacts of cumulative gamma on if that is the threshold that dealers are looking at. So if I look at cumulative gamma, I could see like, "Oh, this is when they're defending this position." And they tend to be long calls, too. So it makes sense that upside lines in the sand are defended so much easier. Seems like downside is not as defended as easy. But you never know, I guess. To me, charm levels kind of encapsulate everything that I'm looking for. I was just kind of more or less talking from a data standpoint, why gamma doesn't necessarily cause a breakout once you cross that line. The stopping power, once you cross those lines, are from vanna and not from gamma. Vanna and charm are going to show you the same thing with the opposite sign. Question: What's your take on the vega? Answer: Essentially vega is looking at impacts of implied volatility from a PnL standpoint and not a delta standpoint. Vanna can also be interpreted as the movement in vega as it relates to the price in the underlying. However, dealers are not hedging PnL. It is good for you to pay attention to Vega when you're putting on an option trade, but when we're talking about dealer hedging, they are neutralizing their PnL through their share purchases. Their share purchases are determined by delta changes. So that's why we in Volland focus on gamma, vanna, and charm... because gamma, vanna, and charm focus on the changes in the deltas, not the changes in the PnLs. Question: Does the concept of "max pain" have any usefulness for intraday trading? Can one look for confluence between it and charm? Answer: Somebody once defined for me what "max pain" meant. And that meant, like, most people are losing buying and selling options. And that's where price trends towards. I think there's a confluence in the fact that sometimes large OI strikes also become large vanna strikes. But there's no flow reason why the max pain thesis would be true. The max pain thesis is a data artifact of the whole vanna thesis. So I think, when you say "can one look for confluence between it and charm," the answer is - just look at charm and the max pain thing will manifest itself. The reason why I would say look at charm and max pain would manifest itself as opposed to the other way around is because OI is two-sided. There are buyers and sellers that have those open contracts, and you don't know how strong dealers are on one side or the other. You probably noticed there are times... like anything with a multiple of 25 in SPX as the largest OI... but when you go into Volland and you look at charm, sometimes 4510 has the largest charm, sometimes 4530 has the largest charm. And that's because dealers are more one-sided on that strike than they are in the 4500 strike. So a lot of times, when people are looking at that max pain thing, they're just looking at OI and saying, "This is where most people lose." Question: A couple of days ago, the 4500 gamma strike was the largest positive strike. What I have found is that the charm effect can play out multiple times off of large positive gamma strikes. My question is whether this effect actually is caused by vanna. Answer: Vanna/charm on the intraday. Yes, the whole playing off of it... Because the whole the whole thing is, is that charm and vanna reverse when you cross over the strike. Because it crosses over, that's when the implied volatility changes changed the behavior of the dealers. And on 0DTE, that is more profound, because implied volatility is going in one direction, which is down. Implied volatility will be zero at the end of the day on 0DTE options. And because of that, if you cross over that strike and all of a sudden implied volatility increases, then the dealers will be doing the same thing. So two things have to happen in order for that strike to have the difference. In 0DTE that's not the case. Implied volatility will become zero. So, you know the direction it's going in. So you know that crossing over, you know, I guess you could say negative charm or positive vanna strikes, is going to change the dealer behavior when you cross over them. And that's why I think our 0DTE idea works so well is because implied volatility is going in one direction, time is going in one direction. So, you know what those people have to do.
0 Comments
0DTE stands for zero days until expiration. These are options that expire that same day. (Likewise, 1DTE, 2DTE, etc. stand for one day until expiration, two days until expiration, etc. Options that expire in one day, two days, etc.) 0DTE charts are available for Volland 3, Volland 30, and Volland Live. They update on the timeframe of your subscription (i.e., 0DTE charts are updated every 30 minutes in Volland 30). To see a 0DTE chart in Volland, select your ticker, your greek, and today’s expiration only. These are the core principles and assumptions underlying this framework. These principles are realistic and have shown to be true with our own observations and discussions with MMs. Under these principles will be their rationale.
Principle #1: Dealers need to be fully hedged by the end of the day, including in 0DTE. In the old days, dealers had to hedge all their 1st- and 2nd-order greeks within a range and fill out a form of their book to prove it. If they failed one greek once, they were warned. If they failed twice, they were fired, and likely not hired to any other MM firm! Also, note that we do not yet know for sure the dealer’s position in the underlying.
Principle #2: Dealers will trade options to become risk neutral in aggregate vanna and charm. Vanna and charm are two sides of the same coin, that being premium of the option. The option premium is made up of two components: time and IV. Both are difficult to hedge when moving quickly, and both move quickly on 0DTE.
Principle #3: Premium is 0 when options expire. This is the primary difference between 0DTE and higher-order Volland. On a higher order Volland (particularly on the 30-day timeframe), there is a consistent spot-vol correlation that is the basis for skew, vanna moves, etc. 0DTE is simpler because IV and time premium run to 0. So, you know exactly the direction of IV and the impact on underlying hedging requirements.
Principle #4: 0DTE options are cheap greeks. While one 0DTE ATM option has a higher gamma than a 20DTE ATM option, its sphere of influence is much smaller. Therefore, as price moves, the greeks of the 0DTE option mean less. This is important because the initial option positioning will have less of an effect the further price moves away from it. Swing trading is a style of trading that involves holding an asset for an intermediate time frame of one day to several weeks in order to profit from price movement, or "swings".
These are the core principles and assumptions underlying the swing trading framework with Volland. These principles are realistic and have shown to be true with our own observations and discussions with MMs. Under these principles will be their rationales. Principle #1: Dealers need to be fully hedged by the end of the day. This is also true in 0DTE.
Principle #2: Dealers hedge to deltas, not PnL. The PnL follows the delta hedging; therefore, dealer delta, vega, and theta are not the greeks to focus on. Gamma, vanna, and charm are. Dealers do have to report their aggregate vega and theta positioning, but they tend to be hedged through /VX futures and other options. On the 0DTE timeframe, they tend to hedge using other options to have dynamic hedging in premium. Principle #3: The 2nd order greek with the most impact is the one with the highest notional hedging.
Principle #4: Dealers account for 35-40% of all underlying movements. This was based on a discussion with the CBOE data team. While dealer hedging accounts for a majority of the underlying movement, there are other traders, including passive investors, hedge funds, stock traders, fundamental traders, technical traders, CTAs, ETF rebalancers, funds, and many other participants, Volland is only dealing with option dealer hedging requirements. Those other traders may oppose Volland, and it may not be a perfect match all the time. Volland shows just one piece of the market movement puzzle – a significant one. Who are Dealers? When an option order is received, a middle man, called an “options dealer”, “options market maker”, or “options wholesaler”, is financially incentivized to accept the order. These entities (individuals, firms, etc.) provide essential liquidity for markets to function. Because they are exposed to adverse selection, they are motivated to hedge their risk. In fact, at the end of every day, this form used to be filled out by the risk manager for each market maker. If any of the categories fell outside an acceptable threshold, the dealer is warned the first time, and fired after their second violation. If fired for this reason, they would not be hired by another dealer firm. Nowadays there are only a few wholesaling companies led by Citadel who handles a large portion of option orders. Currently, most market making is done through algorithms and computers, and there is very little physical trading at an exchange. It is estimated by the Chicago Board of Options Exchange that 85-90% of all option orders are accepted by option dealers. How do Dealers Operate? Dealers have 4 main ways to alleviate their risk. Their first and most preferred choice is to find a willing customer on the other side of the trade to hand off the contract to. This creates guaranteed income with no risk for the dealer. The second choice is to hedge with other options that reduce the overall greeks in the book. The third choice is to hedge with the underlying stock through delta hedging. The fourth choice is to hedge with associated or correlated products, for instance hedging SPX options with a basket of stocks meant to mimic the index, or hedging SPX implied volatility with /VX futures or swaps. What Portion of Market Moves is Option Liquidity? As shown in numerous academic papers, option liquidity and gamma hedging account for roughly one third of underlying trades in equities! It is estimated to be the largest source of equity flow in the market today at any given time. It can be approximated through option notional value traded against equity notional value traded. How Does Volland Measure Option Dealer Positioning?
Volland uses a real-time option trade execution feed through the Option Pricing Regulatory Authority (OPRA) to identify every option trade executed. On an option order-by-order basis using executed price, surrounding orders, Black-Scholes fair value, and Bid/Ask spreads as a guide, Volland determines if each order filled is a buy or a write on the dealer side. For each transaction, Volland calculates the greeks that represent the risk the dealer is assuming. For each strike at each expiration, Volland compiles the total dealer positioning. For the Exposure Sheet, Volland calculates how much of each greek exposure the dealers would have at each strike. This is relevant to determine the hedging momentum for each greek. The charts on the relative value page show the relative exposure compared to the prior 12 months. This helps to indicate if a regime change is arriving and helps contextualize the current environment. These acronyms and terms are specific to the Volland options dealer positioning platform and/or are commonly referenced by Volland users.
For common terminology in the options trading world, please visit the Glossary published by The Options Institute. For common terminology in the futures trading world, please visit the Glossary published by CME Institute. Commonly Used Acronyms 0DTE: Zero days until expiration. Options that expire that same day. 1DTE, 2DTE, etc.: One day until expiration, two days until expiration, etc. Options that expire in one day, two days, etc. AH: After hours AMC: After market close ATM: At the money BD: Broker-dealer BMO: Before market open BTC: Buy to close BTD: Buy the dip BTO: Buy to open CBOE: Chicago Board of Options Exchange CME: Chicago Mercantile Exchange CPI: Consumer Price Index CTA: Commodity trading advisor DAG: Delta-adjusted gamma EOD: End of the day /ES: E-mini S&P 500 Index Futures ETF: Exchange-traded fund FOMC: Federal Open Market Committee GTC: Good-til-cancelled HOD: High of the day HV: Historical volatility ITM: In the money IV: Implied volatility LIS: Line in the sand LOD: Low of the day MM: Market maker MOpEx: Monthly options expiration OpEx: Options expiration OPRA: Option Pricing Regulatory Authority OTM: Out of the money PnL: Profits and losses RTH: Regular trading hours RV: Realized volatility SPX: Standard & Poor’s (S&P) 500 Index SPY: SPDR S&P500 ETF STC: Sell to close STD: Standard deviation STO: Sell to open SVC: Spot-vol correlation VIX: CBOE Volatility Index VWAP: Volume-weighted average price /VX: CBOE VIX Index Futures Commonly Used Terminology Dealer o’clock: Options market makers must end the day hedged. At approximately 2:00-3:00 p.m. Eastern, dealers begin to aggressively hedge their book. Line in the sand (LIS): The strike at which dealers change their behavior – either from buying to selling, or selling to buying. Magnet: The strike that price will be attracted to, usually in reference to positive vanna strikes. Overvixed: There is a clear correlation between the VIX and percent change in SPX. Overvixed – overstatement of VIX – is when VIX runs higher than the SPX change implies. Paradigms: Because of a 0DTE principle which states dealers tend to trade options to become risk neutral in aggregate vanna and charm, you will find that 0DTE charts are frequently uniform in nature. There are few occurrences where the charts are staggered. At different times in specific conditions, customer behavior can fall into one of four paradigms.
Rolling calls: Changing a call position to either a higher strike or further out in time. Skew: The rate of change of implied volatility on an option chain. Vertical skew refers to the implied volatility change within an expiration from one strike to another. Horizontal skew refers to implied volatility change at a fixed strike over different expirations. Spot: Current price of the underlying. Spot-vol correlation (SVC): The linear regression between VIX points and percent change in SPX on a daily timeframe. Strike: The relevant price on an option contract. Undervixed: There is a clear correlation between the VIX and percent change in SPX. Undervixed – understatement of VIX – is when VIX runs lower than the SPX change implies. Vol: Volatility. Newcomers to Volland frequently ask why other option gamma sites' data is incorrect, specifically for GEX calculations. Gamma exposure, better known as GEX, is pervasive on the internet. Many come to Volland frustrated with GEX and hoping it is something different and better. The concept of GEX was introduced by SqueezeMetrics in 2017, in what was a very different time in options trading. It was described in his seminal white paper called “Gamma Exposure”. Because of data available at the time, the paper made some blanket assumptions about dealer positioning. Two of them were the following: 1. Call options are sold by investors; bought by market-makers. It is difficult to determine the “direction” of a trade in an ultra-liquid market, as in the case of SPX options. A vast majority will trade at the midpoint of the bid and ask. It is apparent from an analysis of skew, open interest at strike, and (circularly) the effects of GEX, however, that the practice of call overwriting (and stock collaring) drives the market for calls. 2. Put options are bought by investors; sold by market-makers. As with calls, puts are primarily used by investors who are already exposed to the underlying market, and who are looking to modify the return profile of their portfolio by using options. The “protective put” commands a premium for this reason, thus influencing the apparent vertical skew of index options. At the time, in 2017, these assumptions were somewhat reasonable. Now we have more data, and option demand has exploded. There are now many reasons for investors to trade options, and option volumes have more than tripled since the paper was written. We can safely say that these two assumptions are incorrect in 2023. Yet, most “GEX” services still hold to these assumptions, even though they know they aren’t accurate! The response is “It just works anyway”. Volland is different. We invested in data and networking in order to make a platform that gives accurate dealer positioning.
First, we recognize that dealers make money through bid/ask spreads, and desire to be risk neutral on all other fronts. For the vast majority, this is true. So, we look at which side of the bid/ask spread are trades executed, and assume the dealers are receiving the more favorable pricing. There are some other details that we account for in our formulation which we mitigate using Black-Scholes fair value and surrounding orders and executions. We then calculate the greeks and aggregate based on the net dealer positioning at each strike. Because our methods are more comprehensive, we also don’t stop with gamma. We include vanna, charm, and vomma calculation, as well as all first-order greeks (delta, vega, rho, theta). Looking at vanna and charm specifically, these are crucial to understanding dealer activity, because implied volatility is harder to hedge than gamma. In fact, when you hear a “GEXer” talk about positive gamma strikes being magnets, it is actually vanna that creates this impact. If it were gamma, dealers would need to flip from buying to selling or vice versa to hedge at some point without the underlying changing directions, and that is never the case with gamma. Watch my vanna videos (part 1, part 2) for more details about this effect. To sum up:
So kick your GEX addiction, and be a better trader with Volland. Thanks for reading, and may Volland help you in your future trading ventures. There is a clear correlation between the VIX and percent change in SPX. Sometimes VIX runs higher than the SPX change implies. I call that “overvixing” (overstatement of VIX). The opposite is “undervixing” (understatement of VIX).
When the market overvixes, typically it mean-reverts strongly with an SPX rally and a VIX drop. When the market undervixes, it typically doesn’t strongly mean-revert; it gradually gets more and more undervixed until an event that causes an overvixed drop in SPX. So, overvixing is corrected swiftly due to market maker vanna exposure while undervixing needs a catalyst to be corrected. These terms were originally coined on the Wizard of Ops Twitter: https://twitter.com/WizOfOps/status/1450080292476182528 All corners of #FinTwit have their own personalities, and they need to be evaluated in the light of their industry. Here is my impression of these groups, and how I like to assess what they are saying. Hopefully my red flags are helpful. If you want me to look at an analyst, please share in the comments. I always like finding some new sources of data. Macroeconomists
I have yet to find a macroeconomist that has ever posted that "everything is fine". There is always a problem, and the problem will manifest in minutes instead of years. There may be validity to their claim, but study it for yourself, and figure out what metrics must be studied to forecast the problem is coming true. Also, find and read the opposing viewpoints. I put Fed watchers in this category, but they tend to be less doom and gloom. Zerohedge is in here too. Equity Traders If they are not bots, they typically have a method that has massive blind spots. Technical analysts do not consider fundamental analysis; value traders treat growth like they will eventually get cleaned out; while growth sees value as antiquated. Short sellers troll everything. In some pockets they battle over equities themselves (like a biotech company with a binary event approaching), but more often than not the different strategies are what are being fought over. In this group, I will look at some theses, but validate them myself. Bonds/Rates Traders Because the bond market is more complex and opaquer than all other markets, bond traders troll more than any other. There are camps on either side, and the insults are frequent. The adage is that the bond market is the “smart money”… but it is more like the ego market. Because nobody has a complete grasp of bonds, many assert superiority by attacking the other camp. I just read both sides, and try to assess for myself. One funny thing is when one says another is a charlatan, or a liar, I follow them to get their point of view, too. 😉 Options/Volatility Traders Options traders get very deep in the weeds. This corner of #FinTwit is very mathy/quant, and in many cases is TMI. A lot of that is not as applicable to the typical trader, but it is interesting the more you dig. There is also a weird dynamic in options trading circles that feel like everyone is on the same team. They are the most helpful, possibly because options theses typically are more related to multiple variables. Further, knowledgeable options traders know we aren’t competing against each other; we are trying to find edge within an ecosystem. I’m not afraid to ask questions of options traders. They typically answer well, and it mostly about internal system workings. There is some trolling, but I think that comes naturally in Twitter. Energy Traders Energy trading is closer to a science than any other sector. There is very little new news in the #OOTT crowd. They know how much is being produced, what the consumption seasonality is, futures price flows, etc. Because these traders are knee-deep in it, their opinions are very well-informed. However, this also means there is very little edge. I listen to them, but typically there is almost always consensus. Metals Traders I have not met one metals trader that said gold is going down. The assumption is metals are always going up, and their only job is to determine how deep any dip will be. To be honest, I have found maybe one that I will listen to even a little bit. This article, "The Social-Media Stars Who Move Markets", inspired this post and my Twitter poll responses validated my inspiration. Then there is the trend of red flag posts. It is like the universe wants me to write this. Offering #FinTwit content? Consider this an examination of conscience. # 1. “Look at this fancy car, purse, house, jewelry!!!!” Their non-investment posts are excessively materialistic. The goal is to make you believe they can afford these luxuries bc their trades are so good. Not only are they making money on their viewership (NOT trades), but if that is an attractive feature to you... please examine why you are trading. Successful traders treat their portfolios like a business. Withdrawals are only made if absolutely necessary. The trade of future earnings for a Ferrari is a terrible trade #2. “This trading strategy works EVERY TIME!” This statement ignores changing market environments. Even if there was a magic bullet, it would be front-run. Typically, when this is advertised, they're trying to teach YOU this strategy. It seems great that now you can do this strategy yourself, but shifts responsibility for failing onto you. Now when you lose money, it is your fault that you didn’t follow the strategy correctly. #3. “Diamond hands!! ” “HODL!!” “YOLO BETS!” This person trades by emotion. They will scream at the computer when they are failing, and talk hyperbolic trash when they succeed (e.g. they compare themselves favorably to Warren Buffett). This is a psychological trick (In-Group Favoritism Bias). They align their emotions to yours & you develop a favorable opinion of them. “Diamond Hands”, “HODL”, etc. are subtle ways this manifests; these terms make you feel part of a “retail team”, but you're being taken advantage of. #4. The #FinTwit troll They will mock others with the intent to invalidate their point of view. This is to distract you from the fact that their OWN point of view is fallacious or incomplete. #5. “This just happened and it’s obviously because of THIS reason.” This is retroactive attribution. They will say something that makes sense in retrospect, but has no predictive power going forward. Further, it is short-sighted & is not data-based. Popular financial media universally falls in this category. When you read why the market moved on popular financial media, not only is there a low chance of it being correct, but also a low chance their logic will carry forward. #6. #FinTwit Clichés/adages in problematic context “Sell in May and go away.” “The market can stay irrational longer than you can stay solvent.” “Bulls make money, bears make money, pigs get slaughtered”. These common adages are fun, and - when taken in context - they have an element in truth in them. But that’s the problem; it is that element of truth that leads you into a false thesis. Take, for instance, the adage that gold is an inflation hedge. Look at gold’s correlation to inflation, M2 money supply, or value of the dollar. None of it works. We should demand data or clear logic to back “given” assertions. They must answer the why, at least somewhat satisfactorily. #7. Using past performance to validate an opinion Many successful investors have had a successful year or call that has been publicized; that call becomes the reason all their calls will succeed going forward. Cathy Woods. Michael Burry. They're people, too. Their theses need validation as much as anyone’s. This isn’t to say they have no insight, but validate their theses yourself. Ask why. I mention Woods & Burry because now they're being “Burry-ed”. Had to do it. #8. #FinTwit’s Constant Apocalyptic Proclamations
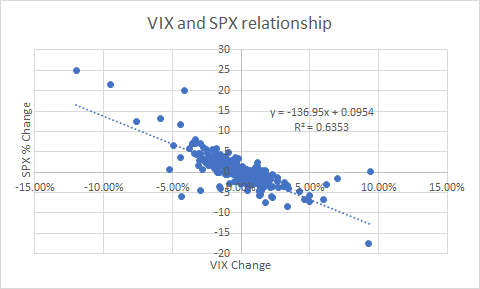
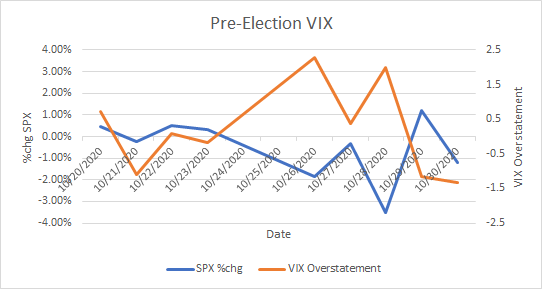
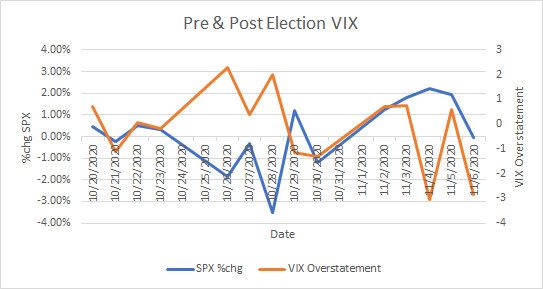
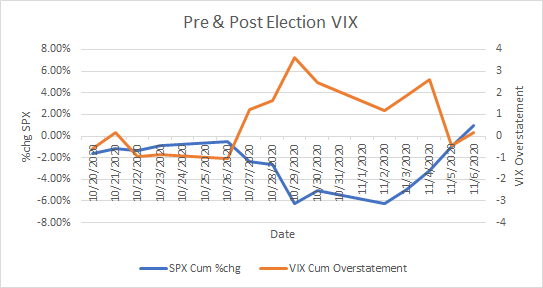
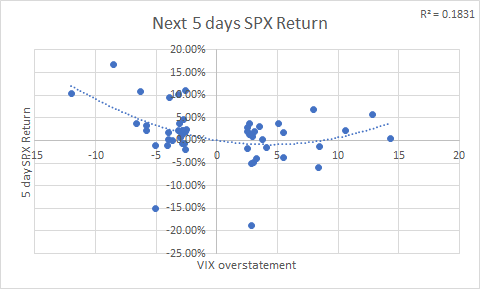
There may be issues with the economy, or the financial system, etc., but a couple things need to be understood when hearing these calls. First, they're designed to stoke fear in you, not wise investment decisions. Second, it is in no one’s best interest for the financial system to collapse. Even a government that most don’t trust will do whatever they can to stop that from happening, even if actions just delay the inevitable. “The Big Short”, “The Smartest Guys in the Room”, and other movies are anomalies, and even somewhat glorify positioning a portfolio for economic collapse. Be careful not to fall into that trap. #9. #FinTwit Technical analysts that claim to be both the why & what of the market This isn't against technical analysis (TA) itself, which I think has a place in analysis. When analysts say the market is moving BECAUSE of a technical reason, that’s a sign that they have no context. Even if correct, a rally didn’t happen because a trendline broke, a bullish engulfing candle was confirmed, we reached a fib, etc. These are signs of something else. They fail as much as succeed and need context to be an effective trading strategy. #10. Ego-Driven #FinTwit They repeatedly show successes and never a failure. They are unwilling to see an alternate point of view presented in comments. Even obvious errors are not taken responsibility for (like a misspelling). That means their theses aren't receptive to alternate points of view, and they cannot be considered comprehensive. These #FinTwit people may be smart, but they are also very obnoxious. Stay tuned for part two! Let me know your thoughts in the comments. This is a post about one of the market correlations that has been consistent over the past decade+, although I will be focusing on 2018-current. The SPX/VIX relationship everyone *knows* exists, but only assumes the correlation and its meaning. $VIX is many things, but at its core it is a measure of implied volatility (IV) on $SPX. This represents the supply and demand in $SPX options. The demand comes from customers while the supply primarily comes from centralized market makers (MMs). Because the MMs have more uniform goals (to isolate and collect premium on their options), the supply side is much easier to analyze. When you look at the SPX/VIX graph, you can’t help but notice how correlated it is. Essentially, MMs have a liquidity comfort level on their offerings given a daily $SPX level. This would be the historically standard premium they are charging you for options on a daily basis. Considering what we know about delta hedging, there is a clear causation as well. If $VIX goes up more than the change in $SPX would indicate, that is a sign that MMs are less willing to sell puts at these levels (VIX overstatement) and vice versa. This is usually in the case of an upcoming event. Once that event passes, IV invariably comes back down. When IV declines, that unwinds hedges and we see massive rallies. Lets take the Biden/Trump election in Nov. 2020 as an example. Here is a chart where orange is the $VIX overstatement and blue is the $SPX return pre-election. Demand was clearly rising for puts pre-election. A lot of that selling was due to MMs hedging those puts. If VIX overstates, market participants are hedging. If the market does not drop below the aggregate premiums on the option chain, be ready for mean reversion. This is from charm and vanna: decay in IV that decreases the value of customer hedges and decreases the amount of hedging needed by MMs. When MMs decrease their hedges, they cover their shorts. What happened after the election didn’t result in the world exploding? Not only did the VIX overstatement mean revert, but SPX did as well. The election wasn’t even settled until much later, and the market already made the decision that the world was not going to explode no matter who won. Here's the cumulative chart during that time: Do you need a quantitative measure of the deviation? On a daily basis, these are the returns of VIX overstatement when it is >-2.5 or <2.5. Those two “outliers” that need to be taken seriously are 3/5/2020 and 3/13/2020. There is a strong indication that when VIX overreacts (+ numbers) downside abates and a mean reversion will happen. The VIX underreactions tend to be soon after the overreactions. This is a a solid indicator but needs to be taken in context of the market at the time.
I don't have data to prove it yet, but this indicator scales. If you see a strong overreaction in a short amount of time, you are likely to see a small bounce. Cumulatively it works too, but I think it scales on a function of a log scale, so I have work to do on that front. In the end, the action is to monitor the deviations VIX has from its SPX correlation. Develop a thesis around the situation it is tracking and act accordingly. It is very likely that we will see mean reversion in both VIX and SPX. This content originally appeared on the Wizard of Ops Twitter here: https://twitter.com/WizOfOps/status/1446117113735749638 |
The WizardJason DeLorenzo Archives
September 2023
Categories |
|







 RSS Feed