
|
0DTE stands for zero days until expiration. These are options that expire that same day. (Likewise, 1DTE, 2DTE, etc. stand for one day until expiration, two days until expiration, etc. Options that expire in one day, two days, etc.) 0DTE charts are available for Volland 3, Volland 30, and Volland Live. They update on the timeframe of your subscription (i.e., 0DTE charts are updated every 30 minutes in Volland 30). To see a 0DTE chart in Volland, select your ticker, your greek, and today’s expiration only. 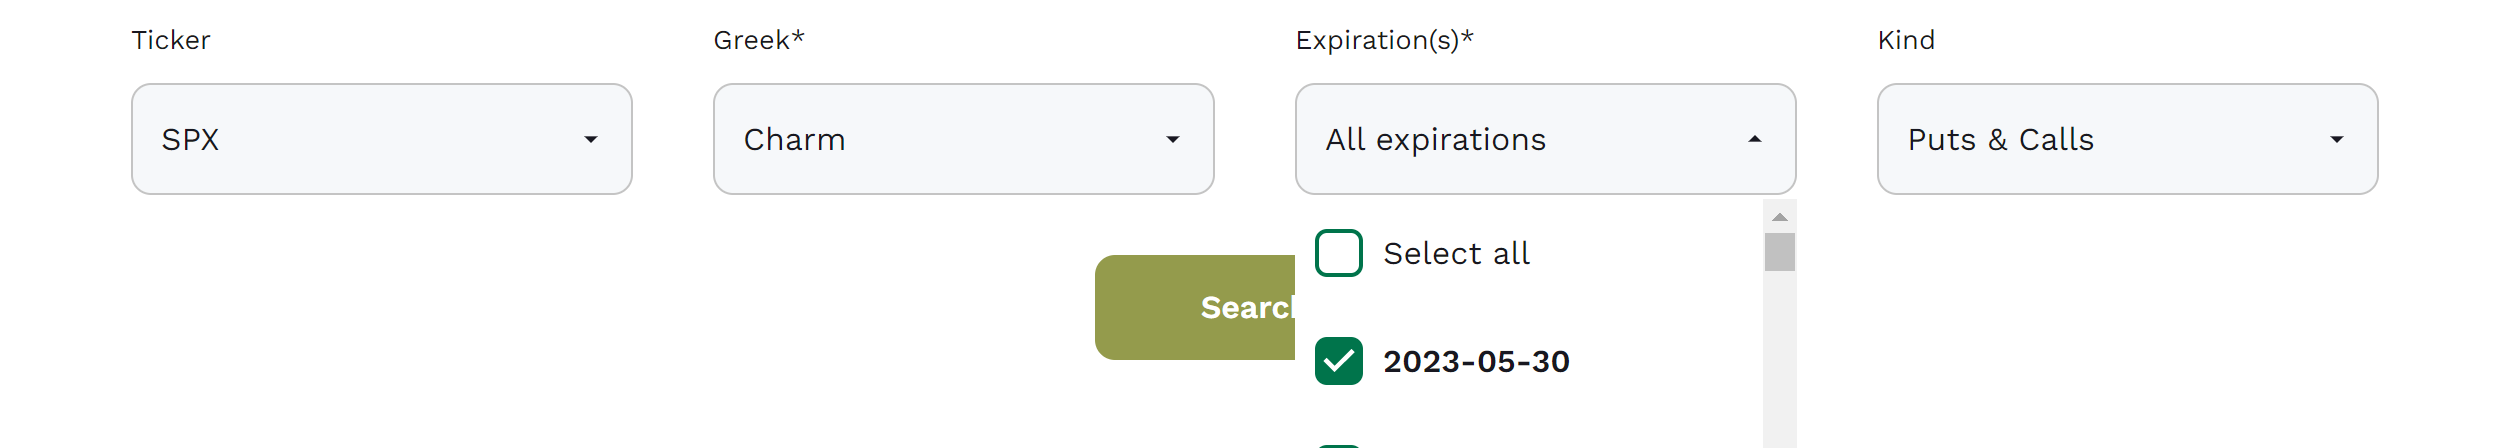 These are the core principles and assumptions underlying this framework. These principles are realistic and have shown to be true with our own observations and discussions with MMs. Under these principles will be their rationale.
Principle #1: Dealers need to be fully hedged by the end of the day, including in 0DTE. In the old days, dealers had to hedge all their 1st- and 2nd-order greeks within a range and fill out a form of their book to prove it. If they failed one greek once, they were warned. If they failed twice, they were fired, and likely not hired to any other MM firm! Also, note that we do not yet know for sure the dealer’s position in the underlying.
Principle #2: Dealers will trade options to become risk neutral in aggregate vanna and charm. Vanna and charm are two sides of the same coin, that being premium of the option. The option premium is made up of two components: time and IV. Both are difficult to hedge when moving quickly, and both move quickly on 0DTE.
Principle #3: Premium is 0 when options expire. This is the primary difference between 0DTE and higher-order Volland. On a higher order Volland (particularly on the 30-day timeframe), there is a consistent spot-vol correlation that is the basis for skew, vanna moves, etc. 0DTE is simpler because IV and time premium run to 0. So, you know exactly the direction of IV and the impact on underlying hedging requirements.
Principle #4: 0DTE options are cheap greeks. While one 0DTE ATM option has a higher gamma than a 20DTE ATM option, its sphere of influence is much smaller. Therefore, as price moves, the greeks of the 0DTE option mean less. This is important because the initial option positioning will have less of an effect the further price moves away from it.
0 Comments
Swing trading is a style of trading that involves holding an asset for an intermediate time frame of one day to several weeks in order to profit from price movement, or "swings".
These are the core principles and assumptions underlying the swing trading framework with Volland. These principles are realistic and have shown to be true with our own observations and discussions with MMs. Under these principles will be their rationales. Principle #1: Dealers need to be fully hedged by the end of the day. This is also true in 0DTE.
Principle #2: Dealers hedge to deltas, not PnL. The PnL follows the delta hedging; therefore, dealer delta, vega, and theta are not the greeks to focus on. Gamma, vanna, and charm are. Dealers do have to report their aggregate vega and theta positioning, but they tend to be hedged through /VX futures and other options. On the 0DTE timeframe, they tend to hedge using other options to have dynamic hedging in premium. Principle #3: The 2nd order greek with the most impact is the one with the highest notional hedging.
Principle #4: Dealers account for 35-40% of all underlying movements. This was based on a discussion with the CBOE data team. While dealer hedging accounts for a majority of the underlying movement, there are other traders, including passive investors, hedge funds, stock traders, fundamental traders, technical traders, CTAs, ETF rebalancers, funds, and many other participants, Volland is only dealing with option dealer hedging requirements. Those other traders may oppose Volland, and it may not be a perfect match all the time. Volland shows just one piece of the market movement puzzle – a significant one. Who are Dealers? When an option order is received, a middle man, called an “options dealer”, “options market maker”, or “options wholesaler”, is financially incentivized to accept the order. These entities (individuals, firms, etc.) provide essential liquidity for markets to function. Because they are exposed to adverse selection, they are motivated to hedge their risk. In fact, at the end of every day, this form used to be filled out by the risk manager for each market maker. If any of the categories fell outside an acceptable threshold, the dealer is warned the first time, and fired after their second violation. If fired for this reason, they would not be hired by another dealer firm.  Nowadays there are only a few wholesaling companies led by Citadel who handles a large portion of option orders. Currently, most market making is done through algorithms and computers, and there is very little physical trading at an exchange. It is estimated by the Chicago Board of Options Exchange that 85-90% of all option orders are accepted by option dealers. How do Dealers Operate? Dealers have 4 main ways to alleviate their risk. Their first and most preferred choice is to find a willing customer on the other side of the trade to hand off the contract to. This creates guaranteed income with no risk for the dealer. The second choice is to hedge with other options that reduce the overall greeks in the book. The third choice is to hedge with the underlying stock through delta hedging. The fourth choice is to hedge with associated or correlated products, for instance hedging SPX options with a basket of stocks meant to mimic the index, or hedging SPX implied volatility with /VX futures or swaps. What Portion of Market Moves is Option Liquidity? As shown in numerous academic papers, option liquidity and gamma hedging account for roughly one third of underlying trades in equities! It is estimated to be the largest source of equity flow in the market today at any given time. It can be approximated through option notional value traded against equity notional value traded.  How Does Volland Measure Option Dealer Positioning?
Volland uses a real-time option trade execution feed through the Option Pricing Regulatory Authority (OPRA) to identify every option trade executed. On an option order-by-order basis using executed price, surrounding orders, Black-Scholes fair value, and Bid/Ask spreads as a guide, Volland determines if each order filled is a buy or a write on the dealer side. For each transaction, Volland calculates the greeks that represent the risk the dealer is assuming. For each strike at each expiration, Volland compiles the total dealer positioning. For the Exposure Sheet, Volland calculates how much of each greek exposure the dealers would have at each strike. This is relevant to determine the hedging momentum for each greek. The charts on the relative value page show the relative exposure compared to the prior 12 months. This helps to indicate if a regime change is arriving and helps contextualize the current environment. These acronyms and terms are specific to the Volland options dealer positioning platform and/or are commonly referenced by Volland users.
For common terminology in the options trading world, please visit the Glossary published by The Options Institute. For common terminology in the futures trading world, please visit the Glossary published by CME Institute. Commonly Used Acronyms 0DTE: Zero days until expiration. Options that expire that same day. 1DTE, 2DTE, etc.: One day until expiration, two days until expiration, etc. Options that expire in one day, two days, etc. AH: After hours AMC: After market close ATM: At the money BD: Broker-dealer BMO: Before market open BTC: Buy to close BTD: Buy the dip BTO: Buy to open CBOE: Chicago Board of Options Exchange CME: Chicago Mercantile Exchange CPI: Consumer Price Index CTA: Commodity trading advisor DAG: Delta-adjusted gamma EOD: End of the day /ES: E-mini S&P 500 Index Futures ETF: Exchange-traded fund FOMC: Federal Open Market Committee GTC: Good-til-cancelled HOD: High of the day HV: Historical volatility ITM: In the money IV: Implied volatility LIS: Line in the sand LOD: Low of the day MM: Market maker MOpEx: Monthly options expiration OpEx: Options expiration OPRA: Option Pricing Regulatory Authority OTM: Out of the money PnL: Profits and losses RTH: Regular trading hours RV: Realized volatility SPX: Standard & Poor’s (S&P) 500 Index SPY: SPDR S&P500 ETF STC: Sell to close STD: Standard deviation STO: Sell to open SVC: Spot-vol correlation VIX: CBOE Volatility Index VWAP: Volume-weighted average price /VX: CBOE VIX Index Futures Commonly Used Terminology Dealer o’clock: Options market makers must end the day hedged. At approximately 2:00-3:00 p.m. Eastern, dealers begin to aggressively hedge their book. Line in the sand (LIS): The strike at which dealers change their behavior – either from buying to selling, or selling to buying. Magnet: The strike that price will be attracted to, usually in reference to positive vanna strikes. Overvixed: There is a clear correlation between the VIX and percent change in SPX. Overvixed – overstatement of VIX – is when VIX runs higher than the SPX change implies. Paradigms: Because of a 0DTE principle which states dealers tend to trade options to become risk neutral in aggregate vanna and charm, you will find that 0DTE charts are frequently uniform in nature. There are few occurrences where the charts are staggered. At different times in specific conditions, customer behavior can fall into one of four paradigms.
Rolling calls: Changing a call position to either a higher strike or further out in time. Skew: The rate of change of implied volatility on an option chain. Vertical skew refers to the implied volatility change within an expiration from one strike to another. Horizontal skew refers to implied volatility change at a fixed strike over different expirations. Spot: Current price of the underlying. Spot-vol correlation (SVC): The linear regression between VIX points and percent change in SPX on a daily timeframe. Strike: The relevant price on an option contract. Undervixed: There is a clear correlation between the VIX and percent change in SPX. Undervixed – understatement of VIX – is when VIX runs lower than the SPX change implies. Vol: Volatility. |
The WizardJason DeLorenzo Archives
September 2023
Categories |
 RSS Feed