|
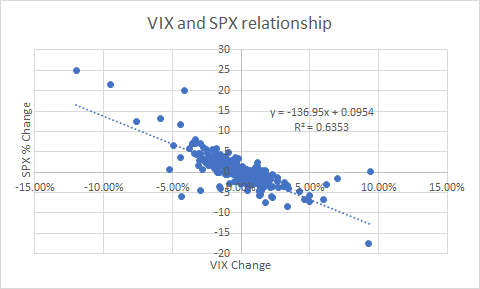
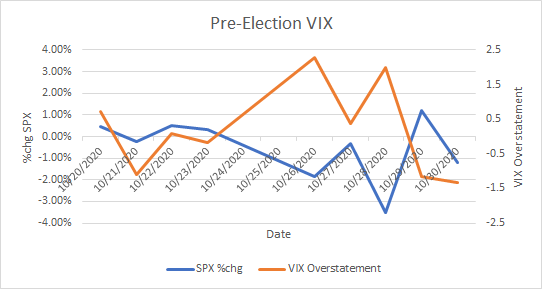
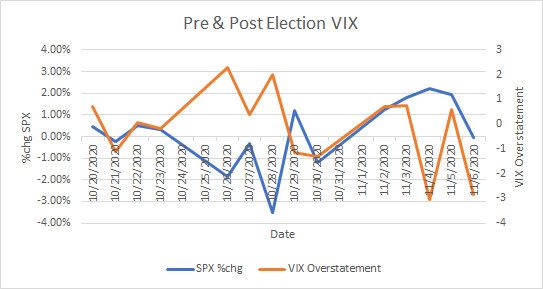
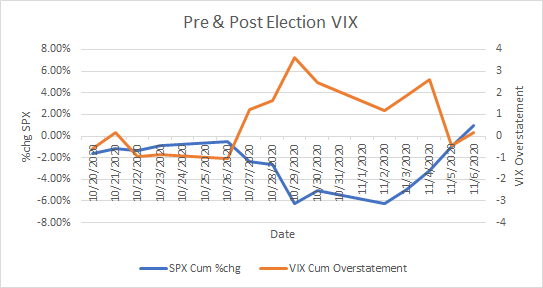
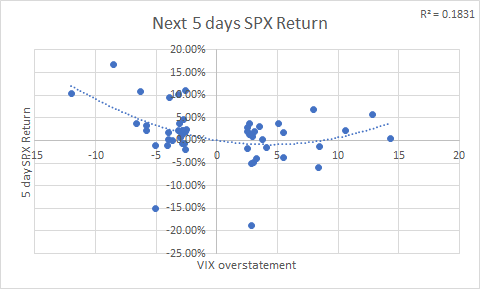
This is a post about one of the market correlations that has been consistent over the past decade+, although I will be focusing on 2018-current. The SPX/VIX relationship everyone *knows* exists, but only assumes the correlation and its meaning. $VIX is many things, but at its core it is a measure of implied volatility (IV) on $SPX. This represents the supply and demand in $SPX options. The demand comes from customers while the supply primarily comes from centralized market makers (MMs). Because the MMs have more uniform goals (to isolate and collect premium on their options), the supply side is much easier to analyze. When you look at the SPX/VIX graph, you can’t help but notice how correlated it is. Essentially, MMs have a liquidity comfort level on their offerings given a daily $SPX level. This would be the historically standard premium they are charging you for options on a daily basis. Considering what we know about delta hedging, there is a clear causation as well. If $VIX goes up more than the change in $SPX would indicate, that is a sign that MMs are less willing to sell puts at these levels (VIX overstatement) and vice versa. This is usually in the case of an upcoming event. Once that event passes, IV invariably comes back down. When IV declines, that unwinds hedges and we see massive rallies. Lets take the Biden/Trump election in Nov. 2020 as an example. Here is a chart where orange is the $VIX overstatement and blue is the $SPX return pre-election. Demand was clearly rising for puts pre-election. A lot of that selling was due to MMs hedging those puts. If VIX overstates, market participants are hedging. If the market does not drop below the aggregate premiums on the option chain, be ready for mean reversion. This is from charm and vanna: decay in IV that decreases the value of customer hedges and decreases the amount of hedging needed by MMs. When MMs decrease their hedges, they cover their shorts. What happened after the election didn’t result in the world exploding? Not only did the VIX overstatement mean revert, but SPX did as well. The election wasn’t even settled until much later, and the market already made the decision that the world was not going to explode no matter who won. Here's the cumulative chart during that time: Do you need a quantitative measure of the deviation? On a daily basis, these are the returns of VIX overstatement when it is >-2.5 or <2.5. Those two “outliers” that need to be taken seriously are 3/5/2020 and 3/13/2020. There is a strong indication that when VIX overreacts (+ numbers) downside abates and a mean reversion will happen. The VIX underreactions tend to be soon after the overreactions. This is a a solid indicator but needs to be taken in context of the market at the time.
I don't have data to prove it yet, but this indicator scales. If you see a strong overreaction in a short amount of time, you are likely to see a small bounce. Cumulatively it works too, but I think it scales on a function of a log scale, so I have work to do on that front. In the end, the action is to monitor the deviations VIX has from its SPX correlation. Develop a thesis around the situation it is tracking and act accordingly. It is very likely that we will see mean reversion in both VIX and SPX. This content originally appeared on the Wizard of Ops Twitter here: https://twitter.com/WizOfOps/status/1446117113735749638
0 Comments
Leave a Reply. |
The WizardJason DeLorenzo Archives
September 2023
Categories |
|

 RSS Feed