
|
Last April, Jerome Powell enacted a policy to encourage lending during the pandemic called the supplementary leverage ratio (SLR) exemption. Banks have an SLR requirement that made them hold a certain amount of capital for every liability to ensure their risks were mitigated. This modification temporarily exempted US Treasuries and deposits (which is a bank liability to an account holder) from being counted in the SLR calculation. This exemption expires at the end of March, and Powell has given no indication whether he will extend it or not. The consequences of the exemption itself relate to bank lending. While households reduced their debt during the pandemic, corporations and the government drastically expanded their credit. Therefore, companies that rely on uncollateralized debt to stay afloat (mostly startup technology, biotech, oil explorers, etc.) will have to pay higher interest rates, and will thereby be hurt by allowing this exemption to expire. On the positive side, if it expires, banks are forced to maintain healthier balance sheets, and will drastically reduce the chance of a market crash. So Powell is forced to make a decision that will have market implications. To try to figure out what Powell will do, I created a game theory tree. There are two participants in the SLR game: the Fed and the market. Theoretically, Powell isn’t supposed to care about the government, nor the rest of the world, so we will take him at his word. It turns out this is the classic prisoner’s dilemma, except with asymmetric information. The market has two choices: 1) Get heavily leveraged or 2) Don't get heavily leveraged. Powell has two choices: 1) Extend SLR or 2) Don't extend SLR. When Powell issued SLR, the market made the decision that it was permanent (hence the large rally in equities and bonds). Corporate and sovereign debt skyrocketed. As a result, growth stocks became highly leveraged, and we financed ourselves out of an oil price war. He knows what the market has done; he knows they essentially "admitted fault" in the prisoner's dilemma game. Powell's missions are full employment and inflation over 2%. Powell knows that not extending SLR gets him the latter. Therefore, I think Powell will sacrifice the short-term market leverage bubble and let SLR go.  So, who would know this on Powell’s team? The banks! The primary dealers take all the bonds no one else wants and receive insight into Fed deliberations. How are banks positioned? The negative repo rates shows heavy shorting of bonds, to the point of paying extra to lend them. That is very indicative of SLR going away. I still think any dip in equities is a buy because of the massive inflation, but growth might take a big short term hit this week. Also… Powell knows this is a big decision, and any time he’s faced with a decision like this he leaks to the press. So, tread carefully until this decision is finalized.
0 Comments
The Gamestop (GME) saga is a compelling one. In short, here’s the story:
A reddit group of retail traders called WallStreetBets has combined their efforts to exploit the market mechanics of options. Namely, this group identifies heavily-shorted stocks and then buys many short-dated calls, which in turn forces option market makers to buy the underlying to hedge their position. The funds that are short those stocks end up getting “squeezed”, meaning they must unwind their positions to satisfy their margin requirements. This creates a parabolic rise in the stock. The winners are the reddit group, as their calls increase in value in multiples. The losers are the short funds and the option market makers. First, the overall market has had this feedback loop for a long time. Volatility traders and tech stock call buyers are the primary drivers of this bullish market since March 2020. This isn’t new; WallStreetBets just took it to the extreme. Second, while I have no sympathy for hedge funds, WallStreetBets are not the good guys. The message board is filled with vile, egotistical sociopaths. They are seeking their own gain at others’ expense, and they gloat about that mission. Further, these traders do not know much about the market mechanics they are taking advantage of. They know enough to be dangerous individually, and collectively they know enough to be dangerous to the whole market. I read many of the posts on their site; they are unequivocally wrong. Many of their ideas that I read about mechanically cannot happen (trying to squeeze the silver market through SLV options). Eventually, these people will be arrested, but for now their collective power must be respected and accounted for. Since the GME explosion, quite a few stocks have seen rallies from speculation. Some of these buyers do not understand the parameters needed for a WallStreetBets short squeeze. BBBY and AMC were good examples; BB turned out to flop. What you need are liquid options offered weekly on a heavily shorted stock. If you want to discuss this further, including some candidates for a play, please send me a note. My overall belief is once these stocks make their massive moves like GME, it will be wise to stay out of them. You are likely to lose money... no matter how you play it. CHEX is an abbreviation that stands for "charm exposure".
Charm in option speak is delta over theta. Essentially, when institutions buy puts for insurance or cover their equity positions with calls, they leave them on whether they are in the money or not. The market maker positions are against those positions, so what we are really measuring is how much gamma has an impact on the market maker hedging positions. The results are compelling. In short, we have logarithmic regression equations with statistical significance and R^2 no less than .4, and in higher GEX environments (like now) R^2 at around .7. The answer to these regression equations are the variance on the mean volatility in that GEX bin. Some of the answers predict these really slow days, which would make for excellent single day butterflies. When you see little price runs, you can fade them by selling verticals and collecting premiums in high CHEX environments safely. This post is in response to the article "UBS Faces Client Backlash Over Options Strategy".
https://www.wsj.com/articles/ubs-faces-client-backlash-over-options-strategy-11566552600 Here is a synopsis of this article as the options trader sees it:
Investment banks are always looking for a silver-bullet strategy that is repeatable and profitable with outsized gains. It is something may work for a while, like this condor strategy, but eventually the math catches up. Repeated processes ignore the fact that market dynamics and options dynamics change, and you need to change with them as well as sufficiently manage risk. VIX, VXX (VXXB), Term Structure, IV, TVIX: what is all of this?
With all the talk about VXX, and it being an indicator of future movement, and the VIX "fear gauge", etc., I want to make clear what these "things" are. It is vital to know exactly what you are looking at when you look at these signals and how they are different. The first question you might be asking is, "Wiz, why don't you stay in your options lane?" My answer is, all of these are based off of the implied volatility of options. Options pricing is basically comprised of 3 variables and one exponential constant. Those variables are: the price of the underlying, the price of the option (as measured by supply and demand of the option itself), and interest rates. The exponential constant is time. We are going to focus on implied volatility (price of the option). Of all the pricing models out there (BSM, Binomial, etc.), implied volatility is what is solved for at any given time. There is no independent measure of it. Time until expiration (and, therefore, time left) can be measured. You can assume a certain interest rate, and that remains an input to the model. You know what the strike price of an option is, as well as the price of the underlying. You also know the price of the option, the answer to the equation. But using all of those inputs, there are still variations in the price of the option that doesn't make the equation equal. This is showing what the supply and demand is of the option itself due to what the public believes is going to happen in the underlying. This is all boiled into one variable called implied volatility (IV). Further, if you have two different people using two different price models, you will likely get two different IVs! Moreover, it is implying the 1 standard deviation movement, so 2 out of 3 days (close enough), the movement of the underlying is expected to be at or below the implied movement that the IV is indicating. VIX is a mathematical model trying to boil down all the SPX option IVs into a single number to gauge what the option-buying public is expecting the market to do. VIX attempts to measure the implied volatility of a range of SPX options between 23 and 37 days until expiration in both weekly and monthly option classes. VXX (unleveraged), UVXY (1.5x leveraged), and TVIX (2x leveraged) are Exchange-Traded Products (ETPs) that are long volatility. They estimate 30-day volatility by buying a weighted average of the next monthly option expiration and the following monthly option expiration. So today, on January 11th, there is a little bit of January options in the VXX bucket and a lot of February options in the bucket. Every day, more Jans get sold and Febs get bought. February options were lower priced than in January for a long while, but have since gone up in price; hence, we have a situation where the people in charge of VXX are buying more expensive options and selling the cheaper ones (giving a red day on VXX despite the red day in SPX). What VXX is really measuring is the difference in price movement between January and February options, NOT option IV itself. Put into a corner, I'd say it is a so-so approximation of option buyers expectation of volatility. Since options are typically overpriced and in contango, in the long run, all of these products will decay. But don't get excited to short them; good luck finding a share to borrow. Term structure is a weighted average of the options in a single expiry. The weights depend on how it is calculated. Basically, it tells you how much the IV is in that expiration date (again trying to boil it into a single number for each expiration), then draws a chart for all the expirations. This at least gives you an idea of the expectation of the implied volatility differences over terms... a little better than VXX to understand the option-buying public's expectation. Finally, what does this all mean for trading? CNBC calls the VIX the "fear gauge", which I understand how they can assign it that, but it is not really true. Since the CBOE basically dictates the initial prices through their market makers, it doesn't necessarily reflect the public's fear except at extremes. If SPX is plummeting and everyone in the world is buying puts, then yes, it is measuring fear... but on a day like today where SPX is down, but not down enough to justify the IVs the options were at, you can see VIX and SPX going down at the same time. You can see that as a lack of fear... but the more accurate assessment is lack of movement compared to recent history. So hearing anyone calling the VIX the "fear gauge" is like nails on chalkboard to me... trying to boil a complex thing into a polarizing soundbite. You must also keep in mind that this is only measuring options traders, and option traders have different motivations. Some are hedging, some are speculating, a majority are market makers trying to play spreads between bids and asks on small ticks and orders (most of the option HFT is doing exactly this)... so it is very difficult to read the incentive for moves in implied volatility particularly on slow days. So ultimately, what does a stock trader do with VIX on their trades? The answer is absolutely nothing except on big moving days. That is, days that are more than the IV is projecting, and see if the volume is way up or not too far up and see if a crash is imminent. But that's about it. If you are an option trader, the VIX is sort of relevant, but there are more important things to account for. For instance, what is the skew, horizontal and vertical? What is the implied movement vs. the historical movement, are these options overpriced compared to history? If so, is there a reason? But to be honest, I haven't really looked at the VIX with anything other than a passing glance in quite some time. A term structure is the mapping of the underlying’s volatility at different expiration dates. The volatility of an expiration date is determined using a weighted average of multiple strikes on the same expiration date. When you compare all of those implied volatilities for each of those expiration dates and graph them, they make a chart. Here is an example: 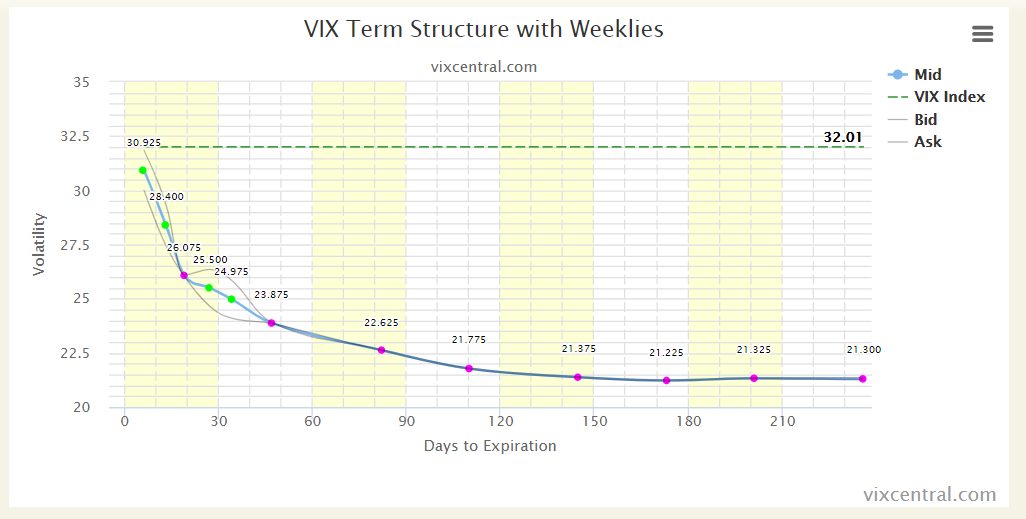 Note, the implied volatilities you see here are for the term of the option class. So if you are looking at weekly term, the implied volatility number shows the implied volatility between the expiry you are looking at and the one that expired in that term before it. So for instance, if you are looking at weeklies (like you see here), the number at the second green dot is showing the implied volatility between the first and second dot, not the second dot and today. Keep that in mind. So how does this help with your strategies? Typically, the term structure looks like the exact opposite of what you see above, a swiftly rising curve that flattens at the top. This is called contango, and expresses the increased uncertainty further out in time. When the curve looks like it does now, it is called backwardation. This happens when the short term is highly volatile and option traders expect the market to return to normalcy in the future. When the market is in backwardation, as it is now, I love to put on calendars. This is because the near-term options are overpriced relative to the options in the outer terms. That makes the trade extremely forgiving if wrong on direction, and allows for multiple sales of options against the same long option. So if I have a hint on direction, I will put on a calendar (especially if bearish), and if I don’t I would consider a double calendar at the long strike’s implied movement strike. These kinds of trades have excellent return to risk. The capital required may be a little higher, but the probability of success is extremely high. The SPX double calendar I have on right now taking advantage of this term structure has an 80% chance of 30% gains over the next 2 weeks. There seems to be a lot of chatter and momentum in the options space about binary options. A binary option is different in that it has two outcomes, max gain or max loss… hence the name, "binary option". So unlike a regular option, these options do not have infinite gains nor variable gains based on how much higher the underlying is above the strike price at expiration. The gain can either be an asset or cash, and these options are bought or sold for a premium.
Basically, these options are like a sports bet. Let’s say you put $10 down on a 50/50 chance for a team to win. If you are right, you get paid back $9, if you lose, you lose $10. Because of this, it is foolish to buy binary options if you are paying a premium since the payout is a 50/50 chance. In fact, in many countries, binary options are considered a form of gambling and are illegal. Many binary option brokerages have turned out to be scams, so when it comes to binary option trading, do not even bother. However, one thing that binary options do offer is a great way to evaluate pricing models and option pricing. From an option pricing point of view, a binary option kind of acts like a vertical at the same strike, making for much easier calculation of return to risk. It also is shown to be a great tool to measure the efficiency of the return of a vertical, since the middle ground of a vertical is the non-binary part of the calculation and tends to get in the way of the OCD option trader’s return to risk calculation. Therefore, a 1 wide vertical in most underlying vehicles can synthetically represent a binary vertical. I highly recommend that, since the return-to-risk is higher in that strategy than any other vertical spread as shown by binary options. In short, binary options are the academic option student’s delight, but from a practical standpoint, they are a scam. If you have watched my webinar series, I warned against going naked calls. Most of the time, brokers do not let you sell calls naked. This weekend, a group called OptionSellers.com went bankrupt for selling calls naked on UNG, or natural gas. Here is their letter to investors: 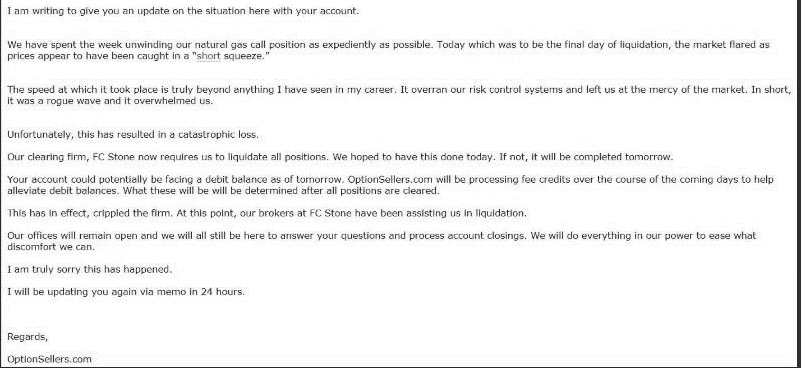 It doesn’t matter why natural gas shot up 10% in 3 days; it happened, and OptionSellers.com should have had a risk management plan.
Being that a major portion of my personal strategy is premium selling, here are some things I am doing differently that would prevent such a catastrophe: 1. NEVER go naked short calls. I would always make short positions into verticals. 2. Delta hedge. You may not make as much money, but it is a major tool in taking drastic moves out of the equation in these positions. 3. Given the above, I will always pay attention to the return to risk. This can be done primarily using the Sharpe Ratio, measuring discounted investment returns over the standard deviation of the probability of its success. But it doesn’t work when the risk is “infinite”. 4. I will manage your portfolio risk responsibly as laid out in our ADV 2A, including not using margin. I guarantee that you would NEVER be found in a debit. Risk management is paramount to my trading strategy, as it should be yours. I cannot guarantee I won’t lose money, but you will not be left in financial ruin like this hedge fund has left their clients. New information coming out of the MTF is suggesting that the current trade we have on is not ideal for the new track. Therefore, we are going to adjust and reconstruct the trade a bit to a balanced butterfly.
All in November, we have an 80/82/83 butterfly, 7 spreads. Make it into a 79/81/83 butterfly. So: buy 14 $82 calls, sell 14 $81 calls... then sell the $80 calls, and buy 7 $79 calls. This creates $20 of slippage in profitability, but aligns the thesis better. We have held this $SPX trade since March, and it is the most successful trade in this newsletter's short history. In fact, it has wielded not only a considerable percentage from the trade itself, but there have been tranches that have added to the equity return.
Today, I am closing it out. I sold the SPX vertical at $10.45, a 221.5% return on this original trade not including the tranches and hedges that were done along the way. Here's why: Avi is talking about a drop to 2830 being a pivotal moment. DaybyDay has a drop to 2790 in the near future. Hadik has a drop to 2800. Further, there are questions among the trusted analysts about this bull market being over, with a multi-month top being put in place. There may be a chance we will see a leg higher, but the long term portion of the equities trade is over. I may play some shorter term equities trades in the future, while I wait for confirmation that the long term bear market trade has begun. |
The WizardJason DeLorenzo Archives
September 2023
Categories |
 RSS Feed